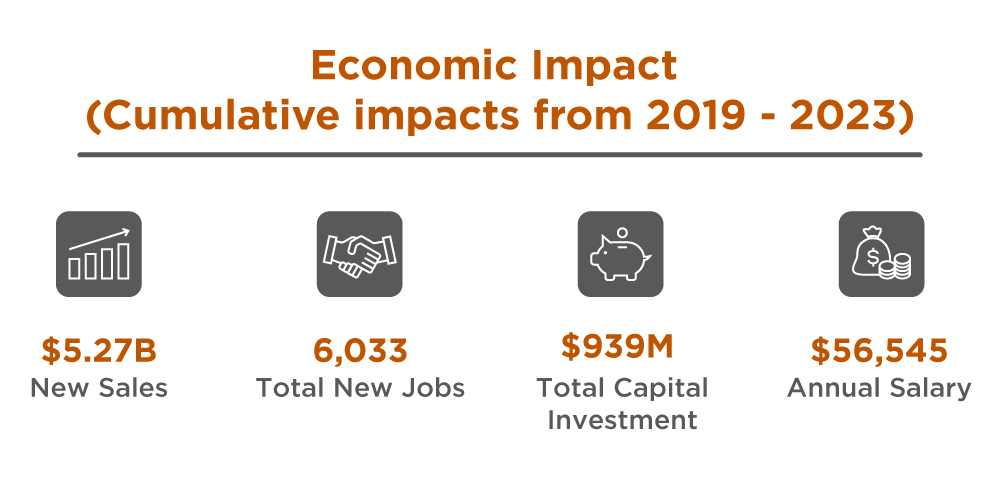
Economic Impact
Economic Impact
Analyzing long-term ripple effects of economic development
The GFMEDC works with a local economist to analyze the ripple effects of new capital investment and jobs on the local market. The analysis provides the return on investment (additional sales in the market and additional employees for example) spurred by the GFMEDC’s assistance with attraction and expansion projects completed by primary-sector companies.
This analysis is specific to 50 local industry sectors, such as banking and healthcare, where additional sales and employees are sustained by the modeled successful projects. The analysis also models construction costs for projects with new buildings and fit ups as well as any equipment locally procured.
The GFMEDC tracks the metrics of successful primary-sector projects: number of jobs, capital investment and square feet utilized. These metrics ripple through the MSA with positive effects, like additional jobs, employee compensation and sales, spilling over into neighboring communities. In the analysis, projects with new jobs and increased property values are analyzed for long term impacts, such as employee compensation, over time. Short-term impacts, such as construction spending, are included in our analysis as well.

Ripple Effect into Main Street
Utilizing economic impact modeling software enables us to delve deeper into understanding the direct, indirect and induced ripple effects stemming from the growth of the region’s primary sector. These effects encompass both ongoing operations and construction activities.
Thanks to the successful projects spearheaded by GFMEDC, the industries listed below are poised for an uptick in their sales once expansion projects reach full employment capacity and construction activities draw to a close.
While the precise figures may vary across economic sectors, it’s noteworthy that recurring impacts, year after year, contribute to approximately 71% of the sales values outlined below.
| Accommodations | $1,160,000 | Motor Vehicle & Parts Dealers | $20,210,000 |
| Administrative & Support Services | $99,480,000 | Museums/Historical Sites & Similar |
$1,548,000 |
| Air Transportation | $4,060,000 | Non-store Retailers | $20,000,000 |
| Ambulatory Health Care | $52,540,000 | Nursing & Residential Care | $24,030,000 |
| Amusement/Gambling/ Recreation |
$9,110,000 | Other Information Services | $8,782,000 |
| Broadcasting | $15,650,000 | Performing Arts & Spectator Sports | $35,916,000 |
| Building Materials & Garden Dealers | $19,140,000 | Personal & Laundry Services | $27,499,000 |
| Clothing & Accessories Stores | $8,010,000 | Professional/Scientific/Tech Services | $200,700,000 |
| Construction | $472,060,000 | Publishing Industries | $261,440,000 |
| Credit Intermediation & Related | $13,800,000 | Rail Transportation | $19,630,000 |
| Data Processing, Hosting & Related Services | $15,180,000 | Real Estate | $215,070,000 |
| Educational Services | $19,027,000 | Religious/Grantmaking /Civic/Professional |
$25,360,000 |
| Electronics & Appliance Stores | $9,528,000 | Rental & Leasing Services | $59,300,000 |
| Food & Beverage Stores | $19,070,000 | Repair & Maintenance | $31,530,000 |
| Food Services & Drinking Places | $44,980,000 | Scenic and Sightseeing Transportation | $11,530,000 |
| Funds/Trusts/Other Financial | $55,734,000 | Securities, Commodity Contracts & Other Financial |
$22,290,000 |
| Furniture & Home Furnishings | $49,084,000 | Social Assistance | $11,510,000 |
| Gasoline Stations | $7,815,000 | Sports/Hobby/Book/Music | $4,140,000 |
| General Merch Stores | $15,260,000 | Telecommunications | $24,180,000 |
| Government | $8,564,000 | Transit & Ground Passenger Transportation | $8,610,000 |
| Health & Personal Care Stores | $5,892,000 | Truck Transportation | $51,500,000 |
| Hospitals | $54,100,000 | Utilities | $58,370,000 |
| Insurance Carriers & Related | $69,350,000 | Waste Management & Remediation Services | $2,933,000 |
| Lessor Non-finance Intangible | $7,940,000 | Water Transportation | $2,773,000 |
| Misc. Store Retailers | $7,860,000 | Wholesale Trade | $307,210,000 |
| Accommodations | $1,160,000 |
| Administrative & Support Services | $99,480,000 |
| Air Transportation | $4,060,000 |
| Ambulatory Health Care | $52,540,000 |
| Amusement/Gambling/Recreation | $9,110,000 |
| Broadcasting | $15,650,000 |
| Building Materials & Garden Dealers | $19,140,000 |
| Clothing & Accessories Stores | $8,010,000 |
| Construction | $472,060,000 |
| Credit Intermediation & Related | $13,800,000 |
| Data Processing, Hosting & Related Services | $15,180,000 |
| Educational Services | $19,027,000 |
| Electronics & Appliances Stores | $9,528,000 |
| Food & Beverage Stores | $19,070,000 |
| Food Services & Drinking Places | $44,980,000 |
| Funds/Trusts/Other Financial | $55,734,000 |
| Furniture & Home Furnishings | $49,084,000 |
| Gasoline Stations | $7,815,000 |
| General Merch Stores | $15,260,000 |
| Government | $8,564,000 |
| Health & Personal Care Stores | $5,892,000 |
| Hospitals | $54,100,000 |
| Insurance Carriers & Related | $69,350,000 |
| Lessor Nonfinance Intangible | $7,940,000 |
| Misc. Store Retailers | $7,860,000 |
| Motor Vehicle & Parts Dealers | $20,210,000 |
| Museums/Historical Sites & Similar | $1,548,000 |
| Non-store Retailers | $20,000,000 |
| Nursing & Residential Care | $24,030,000 |
| Other Information Services | $8,782,000 |
| Performing Arts & Spectator Sports | $35,916,000 |
| Personal & Laundry Services | $27,499,000 |
| Professional/Scientific/Tech Services | $200,700,000 |
| Publishing Industries | $261,440,000 |
| Rail Transportation | $19,630,000 |
| Real Estate | $215,070,000 |
| Religious/Grantmaking/Civic/Professional | $25,360,000 |
| Rental & Leasing Services | $59,300,000 |
| Repair & Maintenance | $31,530,000 |
| Scenic and Sightseeing Transportation | $11,530,000 |
| Securities, Commodity Contracts & Other Financial | $22,290,000 |
| Social Assistance | $11,510,000 |
| Sports/Hobby/Book/Music | $4,140,000 |
| Telecommunications | $24,180,000 |
| Transit & Ground Passenger Transportation | $8,610,000 |
| Truck Transportation | $51,500,000 |
| Utilities | $58,370,000 |
| Waste Management & Remediation Services | $2,933,000 |
| Water Transportation | $2,773,000 |
| Wholesale Trade | $307,210,000 |
*Source for Impact Data: Bangsund, Dean A. 2023. Analysis of Recent GFMEDC Business Expansions on FM Economy

